Understanding Professors: Graphical Expositions
27 August 2008 at 4:32 pm Peter G. Klein 2 comments
| Peter Klein |
Here are some diagrams to help you understand how professors think. First, how they spend their time, from PhD Comics (via Art Carden). Click to enlarge.
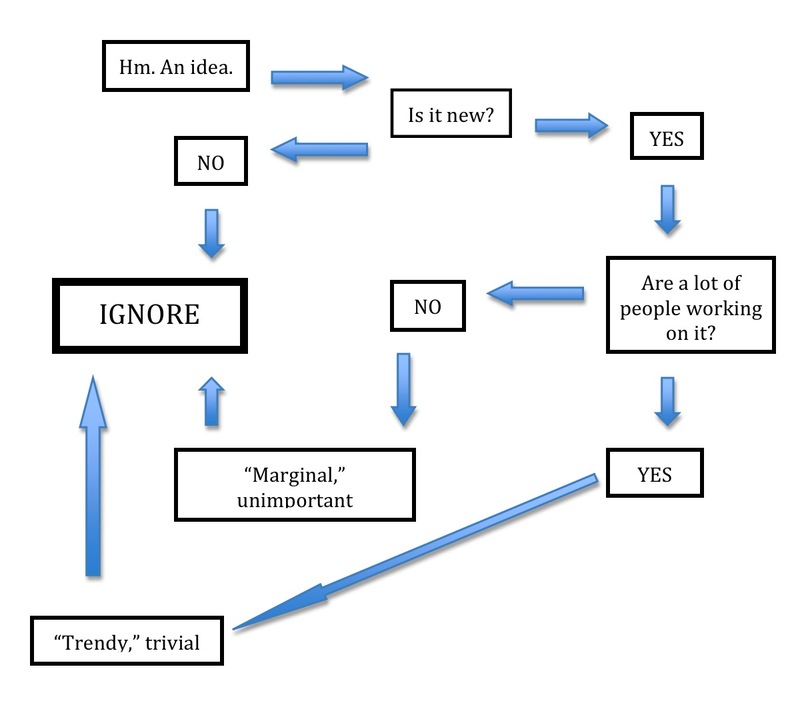
Second, how they choose research topics, from Marc Liberman (via Newmark):
2 Comments Add your own
Leave a comment
Trackback this post | Subscribe to the comments via RSS Feed


1. Donald A. Coffin | 27 August 2008 at 4:43 pm
Phil Miller at Market Power has the tenured/untenured modification of the “research topics” part of this:
http://marketpower.typepad.com/market_power/2008/08/flowchart-for-a.html
Don Coffin
2. Praja Rajyam | 2 September 2008 at 2:30 pm
Sometimes, I think I am lucky ’cause I am not a professor. Sometime I envy them. Nice post, Peter Klein.
– Anand.